-1.png?width=1132&height=292&name=Asset%201@2x%20(12)-1.png "Odins.ai Logo")
Most marketing budgets are set by tradition, not evidence
Ask how the marketing budget was set and you'll usually hear some version of: 'last year's number, adjusted for growth targets.' Maybe benchmarked against competitors. Maybe negotiated upward by whoever argues best.
What's almost never part of the conversation is the actual relationship between spend and outcome. At what point does the next million stop earning its keep? Is €15M the right number, or would 120M deliver 90% of the return? Would 180M pay for itself twice over?
Without a model that links spend to outcome at every level, the total budget is essentially a guess — dressed up with enough process to feel rigorous.
A marginal return curve for your entire marketing portfolio
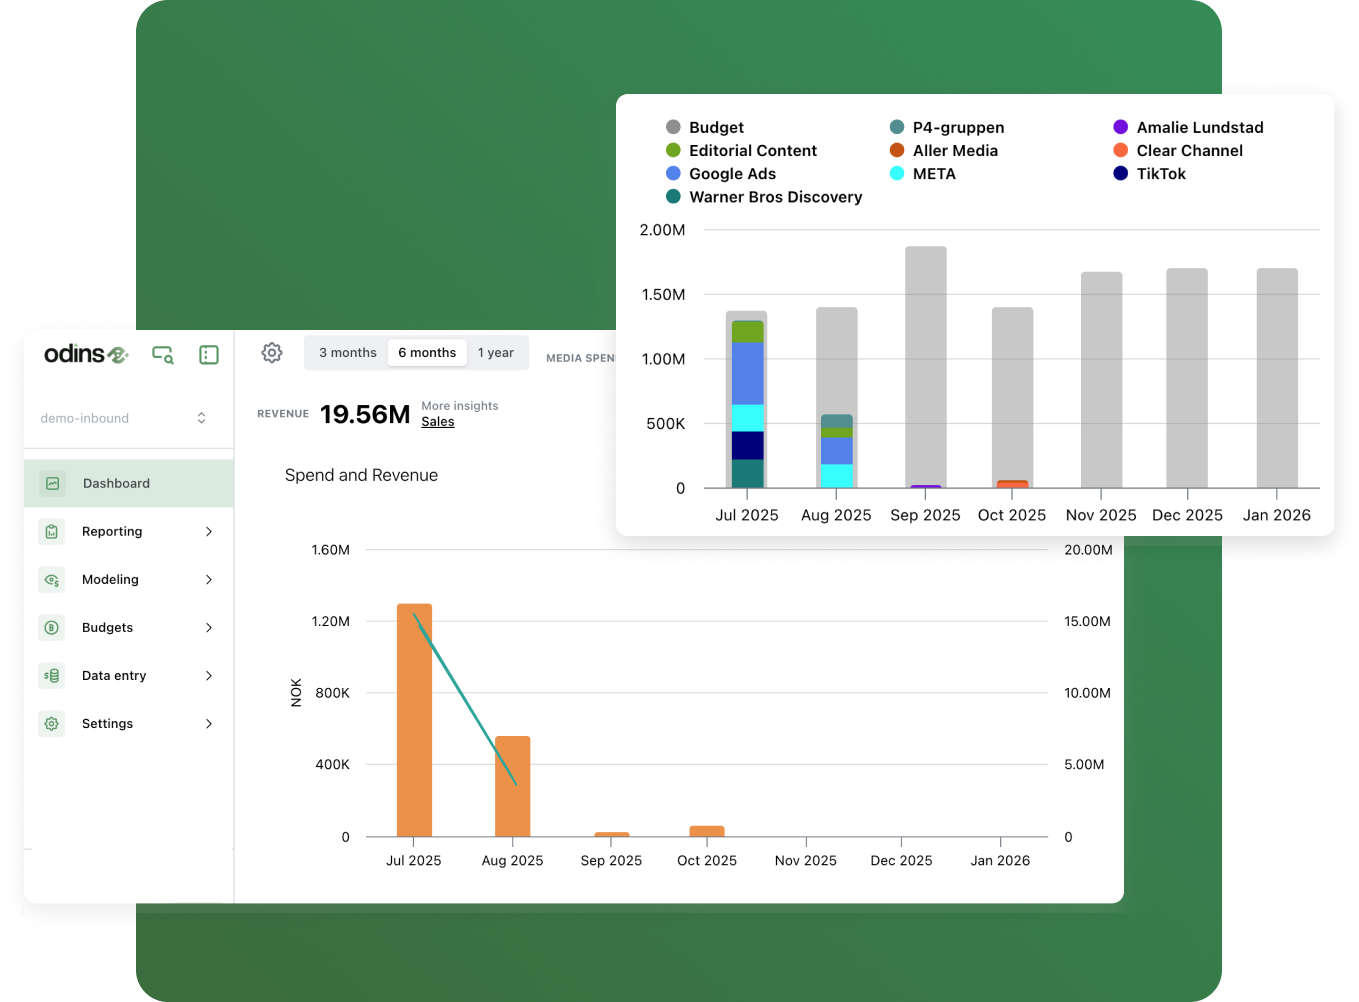
The model estimates the relationship between total marketing spend and business outcomes — revenue, leads, applications, whatever your key metric is. Not as a single average ROAS number, but as a curve: what does each additional unit of spend deliver?
At the low end of the curve, returns are strong — you're funding the channels with the most headroom. As total spend increases, you progressively fill channels that are closer to saturation. At some point, the marginal return drops below your threshold. That inflection point is your optimal total budget.
This isn't theoretical. The model calculates it from your own data, with confidence ranges that tell you how certain the estimate is.

Marketing intelligence that drives growth


The model maps spend to outcome across your full portfolio
Using your historical data — spend by channel, business outcomes, and control variables — the model estimates saturation curves for every channel simultaneously. This produces a portfolio-level view: how total spend translates to total outcome, accounting for how channels interact and compete for diminishing returns.
The result is a curve that shows the expected return at every spend level. Not just the current level — every level. You can see what happens if you spend 20% less, 10% more, or double the budget.
- Saturation curves estimated for all channels simultaneously
- Portfolio-level view, not channel-by-channel
- Expected outcome at every spend level
- Based on your data — not benchmarks or industry averages

Find the inflection point where marginal returns drop off
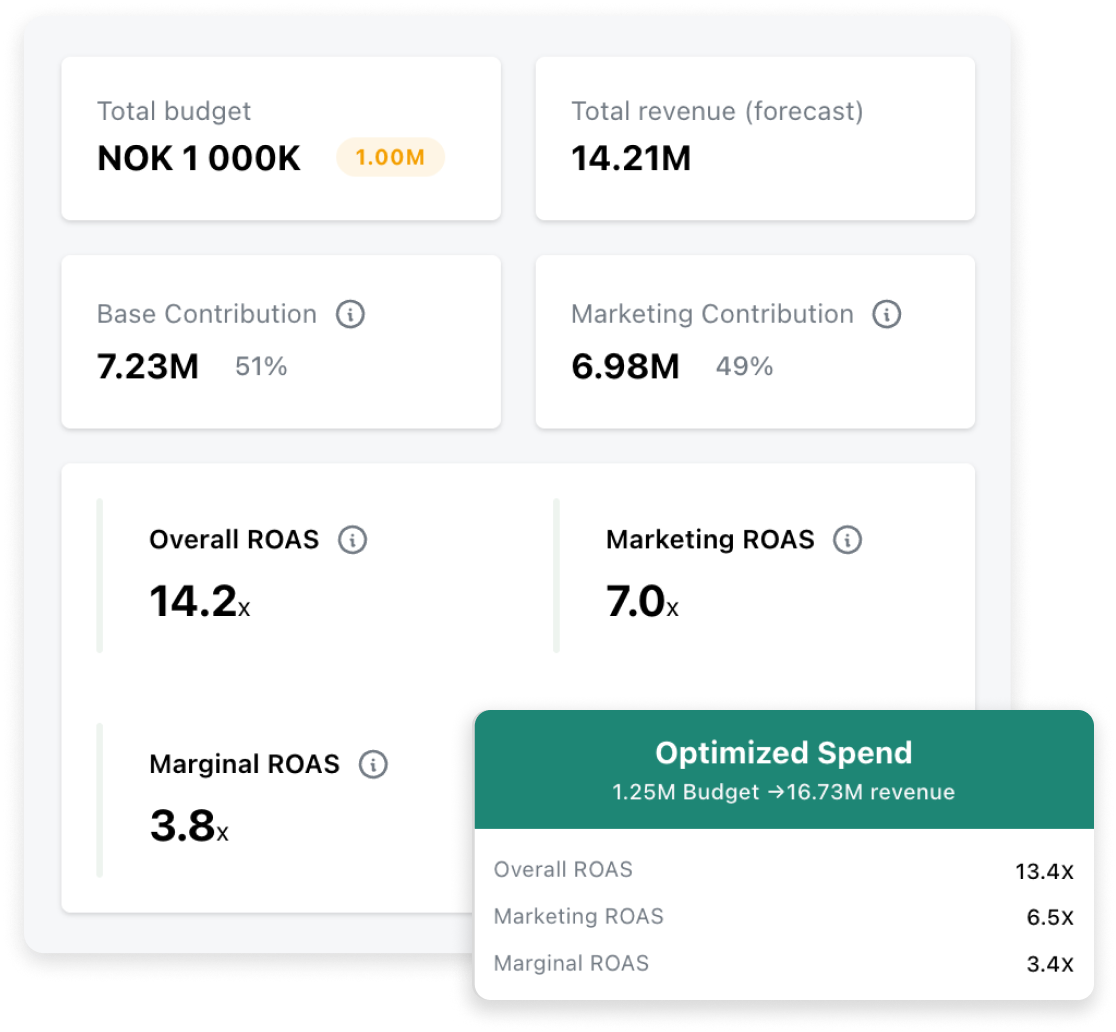
The marginal return curve is the derivative of the total return curve — it tells you what the next euro delivers. At low spend levels, marginal returns are high. As you increase spend, they decline as channels saturate.
The inflection point — where marginal ROAS drops below your target return — is the economically optimal total budget. Spend below it and you're leaving profitable growth on the table. Spend above it and you're funding channels that don't earn their keep.
Your CFO gets a number they can evaluate with the same rigor as any other capital allocation decision.
- Marginal ROAS calculated at every spend level
- Clear inflection point where returns drop below target
- Confidence range shows how certain the estimate is
- Directly answers: 'Should we spend more or less?'
Compare budget scenarios before committing
Before the budget is approved, run scenarios: what does €12M vs. 150M vs. 175M deliver? Each scenario shows the total expected outcome, the marginal efficiency, and the optimal channel allocation at that spend level.
You present the board with concrete options — not a single number to approve or reject, but a menu of trade-offs. 'Option A delivers X with high confidence. Option B delivers Y with moderate confidence. Option C has the highest potential but the widest range.' That's a conversation that leads to better decisions.
- Multiple scenarios compared side by side
- Each shows total outcome and marginal efficiency
- Optimal channel mix recalculated per scenario
- Exportable for board presentations and financial planning
Revisit monthly as data refines the picture
The model retrains every month. As new data arrives, the saturation curves update, the marginal return estimates sharpen, and the optimal budget level may shift. If the market changes — new competition, economic shifts, seasonal patterns — the model captures it.
Total budget right-sizing becomes a continuous process, not an annual event. You know at any point whether the current budget is too high, too low, or just right — and you have the evidence to act on it.
- Monthly retraining with latest data
- Confidence ranges narrow over time
- Budget recommendations adjust as conditions change
- Continuous optimization, not annual guesswork
CEOs setting the total investment envelope
You need to know whether the marketing budget is the right size — not just how it's allocated. The model gives you a defensible answer grounded in your own data, with the confidence range to know how much to trust it.
CFOs evaluating marketing as a capital allocation decision
Marginal returns, confidence ranges, scenario comparisons. The same rigor you'd apply to any other major investment — applied to the largest discretionary line item.
CMOs defending or expanding the budget
Walk into the board meeting with scenarios, not a single number. Show what you'd deliver at the current level, what you'd lose with cuts, and what you could gain with additional investment.
Aprila Bank used the model to reallocate budget and increased applications by 37%
Aprila Bank — a Norwegian fintech — used Odins to understand where their marketing budget was working and where it was saturated. The model identified channels where additional spend had diminishing returns and channels with untapped headroom.
By reallocating based on the model's recommendations, total loan applications increased by over 37% without increasing the total budget.
"By leveraging MMM in Odins.ai, we're able to identify the optimal mix, and make informed decisions about budgeting and ROI."
— Nicole Lenouvel Hanssen, Marketing Manager, Aprila Bank
Trusted by marketers world wide
