-1.png?width=1132&height=292&name=Asset%201@2x%20(12)-1.png "Odins.ai Logo")
Reporting & insights
One view across everything, always current
Get a complete cross-channel view of marketing spend and performance, online and offline, side by side. Updated automatically. No pipelines to maintain, no dashboards to rebuild.
Your data is everywhere. Your view shouldn't be.
Most marketing teams piece together performance from platform-specific dashboards. One for Meta, one for Google, one for TV, one for the CRM. Each shows a different slice, with different definitions, at different update frequencies.
Odins gives you a single, structured view across all channels. The same data that feeds the marketing mix model also feeds your reports. This means what you see in the dashboard and what drives your planning decisions is always the same.
Three views, one source of truth
Every report draws from the same structured dataset. Whether you need a high-level overview or channel-specific detail, the numbers always reconcile.
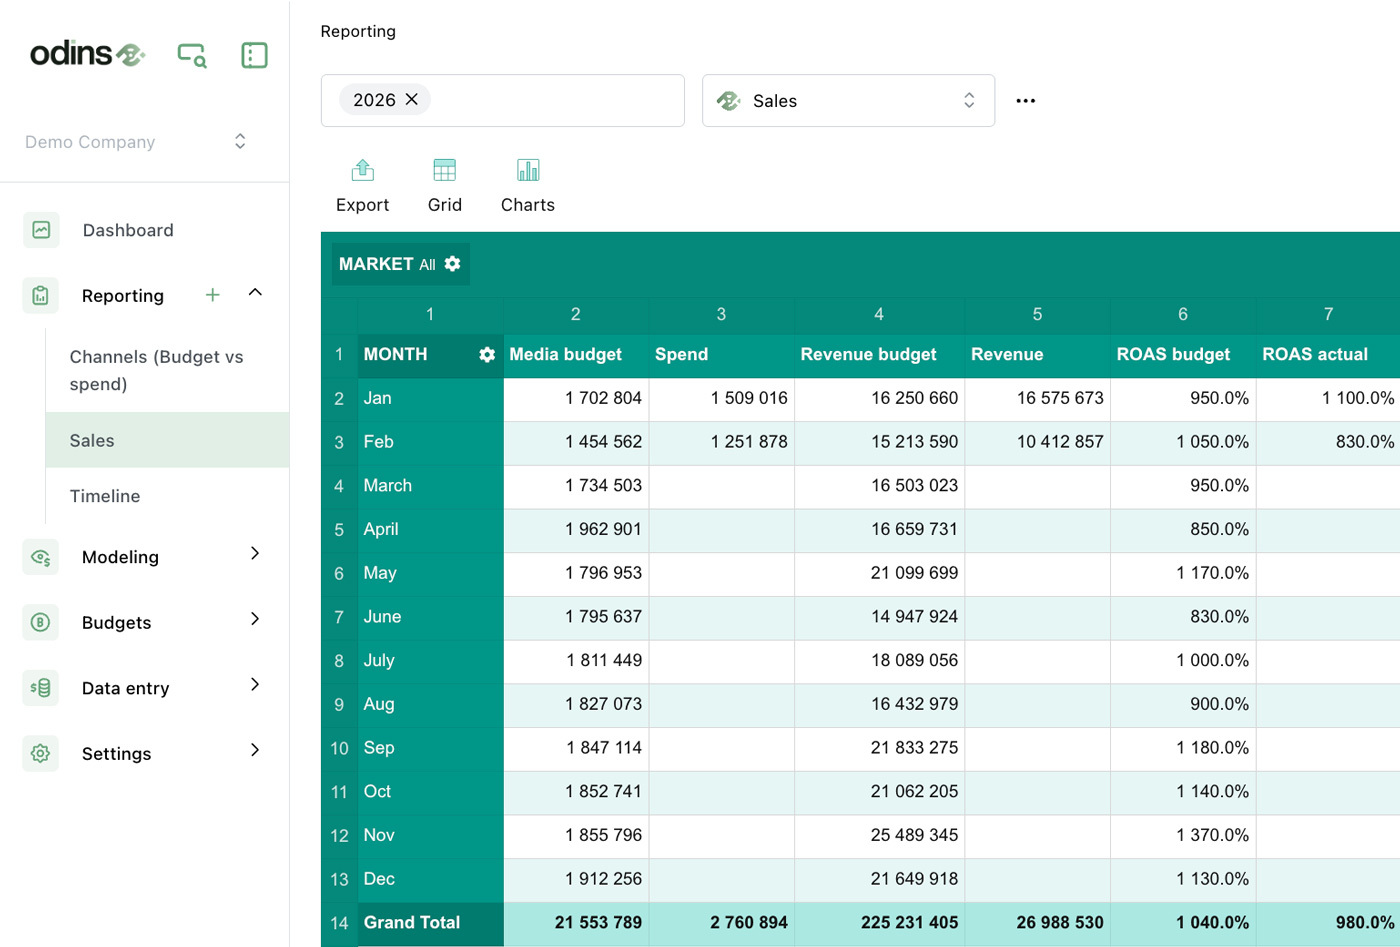
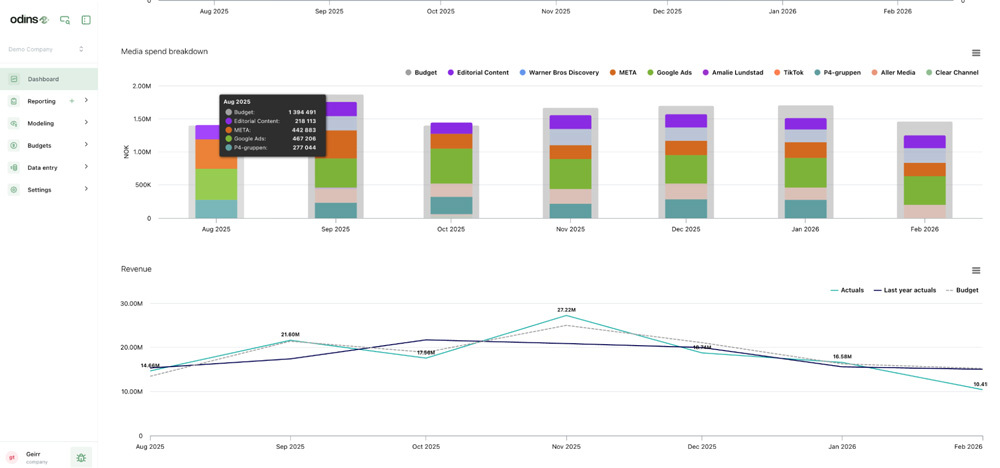
See all channels in one place
Total marketing spend and performance across every channel, online and offline, in a single view. Broken down by channel, period, and KPI. No manual aggregation, no spreadsheet stitching.
Compare cost, impressions, and outcomes across channels that don't normally sit side by side. When TV, paid search, and social are in the same view, the relative scale becomes obvious.

Metrics that go beyond last-click
Because the data feeds directly into a marketing mix model, you also get metrics no dashboard tool can generate on its own: incremental contribution per channel, saturation levels, and marginal ROAS.
These are outputs of the model, not raw data. They show what actually drove the result, and how much room each channel has left to grow. Learn how the model works →

Use it here, or push it to your own tools
View reports directly in Odins, or push the structured dataset to your own data warehouse. Connect it to Power BI, Looker, or whatever your team already uses.
You can also grant limited access to external partners. An agency can follow costs vs. budget and performance for the channels they manage, without seeing the full picture.
Either way, you're working from the same source of truth. The same data powers the models, the scenarios, and the recommendations.


Already structured
Your data is cleaned and harmonized as part of onboarding. Reports work from day one. No ETL to maintain.

Model-connected
The same data feeds the MMM. What you see in reports is what drives your planning and recommendations.

Always current
Data updates automatically. No weekly refresh rituals, no broken pipelines to fix on Monday morning.

Offline included
Channels that most dashboards ignore, like TV, radio, print and OOH, are included alongside digital.

For the CMO
A single view that shows total marketing performance across all channels. Walk into any meeting with consistent numbers, not a patchwork of platform reports.
For the CFO
Clear, auditable data on marketing spend and return. One source of truth with no discrepancies between what marketing reports and what finance sees.
For the media team
Channel-level detail updated automatically. Spend less time pulling data and more time acting on it.
The foundation for everything else
Reporting isn't a standalone feature. It's the visible surface of a system that also powers scenario planning and monthly recommendations.
The same structured data feeds the model, the scenarios, and the reports. When you look at a number in a report, it's the same number the model uses to generate your next recommendation.

Trusted by marketers across finance, retail, and consumer brands
